
Tools were developed to bridge niche-based model predictions with one or two process-based models. These models were applied to various pilot sites – MKRF, Canada; Fujian site, China; Central Highlands Region, Australia. This allowed us to determine the impacts of climate change on forest ecosystems within these sites, develop adaptation strategies, and produce decision-matrices to rank various management strategies.
TACA/LANDIS-II
TACA and LANDIS-II models were applied to the Central Highlands Region (CHR) pilot site in Victoria, Australia (Figure 1). These models were used to project the response of species and ecosystems to climate change. Modelling was conducted for 32 Eucalyptus species with a focus was on Eucalyptus regnans. E. regnans is the most sought after species for timber production in the region and is a key contributor to water production, carbon stocks, and habitat for native wildlife.
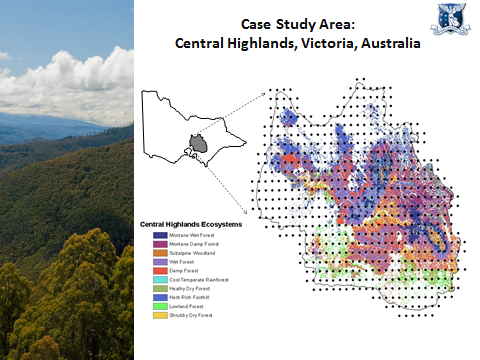
Figure 1: Central Highlands Region study site in Victoria, Australia. Points represent the spatial grid of climate data used in the analysis.
The TACA-GEM and TACA-GAP models were used to model the suitability of a site for species regeneration and survival and to estimate the annual net primary productivity and maximum biomass that a species can achieve on a given site under different climate scenarios, respectively. LANDIS-II was used to simulate ecological processes, such as succession, seed dispersal, disturbance, and climate change, using regeneration and productivity parameters from TACA-GEM and TACA-GAP. A meta-model was then employed to assess the ability of adaptation strategies to mitigating the impacts of climate change on forest services.
A range of alternative management scenarios were developed and modelled to test the interaction between management, climate change, and ecosystem services. Management strategies were developed by local forest managers and Masters of Forest and Ecosystem Science students to try and to address the impacts of climate change and maintain the current range of ecosystem services. The services addressed were timber production, water production, carbon stocks, and habitat for Leadbeater’s possum (Gymnobelideus leadbeateri).
Results
E. regnans was modelled to have its regeneration niche and productivity niche contract to higher elevations; however the contraction in the regeneration niche was far greater than the fundamental niche, which highlights that regeneration may become more limiting under climate change then growth (Figure 2).
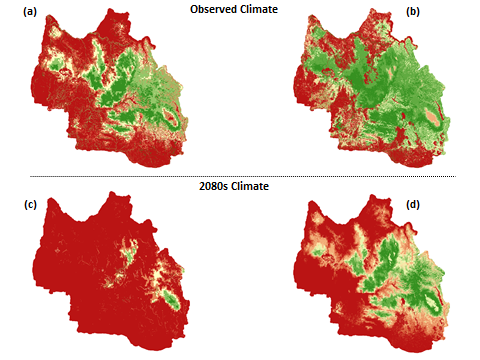
Figure 2: Regeneration (a, c) and Productivity (b, d) results for E. regnans under historic (a, b) and 2080s climate change (c, d). Red to green scale indicates increasing suitability for growth and regeneration. Maximum regeneration score equals 1.0 and maximum productivity equals 1250 tonnes biomass per hectare.
Landscape modelling of the impacts of climate change on E. regnans forests could results in a 48.2% (+/- 2.1%) decline in the species distribution compared to a 6.7% (+/- 1.9%) decline that may occur without climate change over a 200-year period. The modelling also identified areas on the landscape where E. regnans remains resilient to climate change. Figure 3 summarizes the spatial impact of climate change on this species, but also the impact of management, fire, and climate change on the growth stage distribution. As much of the resilient areas are located in protected areas, the effect of management is negligible, though a recruitment bottleneck is evident under climate change.
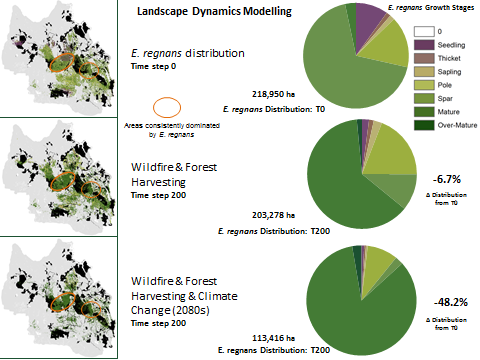
Figure 3: Landscape distribution and dynamics of E. regnans under a factorial of management and climate change. Recruitment bottleneck is evident in the bottom chart and orange circles areas indicate areas of potential resilience. Black areas indicate protected areas (parks of special protection zones).
Analysis of the impacts of climate change on the production of the four ecosystem services yielded general trends towards a collapse in the amount of timber that can be harvested and in the amount of Leadbeater’s Possum habitat under climate change. Water production and carbon stocks both increase over time as the forest ages and ash forests transition to dry eucalypt forests that use less water.
FORECAST Climate
FORECAST Climate was applied to the Malcolm Knapp Research Forest (MKRF) in British Columbia and the Fujian pilot site in China. The principal objective was to assess the long-term impacts of climate change on forest growth rates and mortality, and to develop adaptation strategies for forest management practices and species selection.
FORECAST Climate was developed as an extension of the hybrid forest growth model FORECAST (Kimmins et al. 1999) created through the dynamic linkage of FORECAST with the stand-level hydrology model ForWaDy (Seely et al. 1997). The linked model is capable of representing the impact of climate and climate change on forest growth dynamics. Specifically, it includes detailed representations of the relationships between temperature and water stress on growth rates, as well as the effect of temperature and moisture contents on decomposition and nutrient cycling. The model also includes a function to represent mortality associated with severe drought events.
FORECAST Climate was calibrated for Douglas-fir (Pseudotsuga menziesii), western redcedar (Thuja Plicata), and western hemlock (Tsuga occidentalis) at the Malcom Knapp Research Forest (MKRF) located in coastal British Columbia and for Chinese-fir (Lacelotta Cunninghamia) plantations in Shunchang county in the north central part of Fujian Province, China.
Malcom Knapp Research Forest
The application of FORECAST at MKRF focused on an evaluation of the long-term impacts of two alternative climate change scenarios on the growth and development of Douglas fir, Western hemlock, and Western red cedar. Climate change projections were taken from two IPCC AR5 GMCs, with outputs generated for 2020, 2050, and 2080. This model projects the impacts of climate on tree growth, ecosystem development, and mortality rates through their relationships to temperature and water stress. Annual merchantable volume production was then determined based on the expected growth rate. Additionally, this model projects decomposition rates and nutrient cycling under climate change to further understand how these environmental factors will influence the productivity of the ecosystem. A database of stand-level growth summaries was then generated for use in the landscape-scale analyses. The calibrated model is available for managers to evaluate additional management options and/or climate change scenarios for any tree species of interest.
Results
Although climate change led to an increase in water stress, the model predicted an increase in productivity of 50-70% for Douglas-fir and 25-34% for western hemlock stands after 60 years of climate change (year 2073) relative to the reference climate scenario (Figure 4). This was primarily related to an increase in the length of the growing season leading to increased growth rate during the spring and fall.
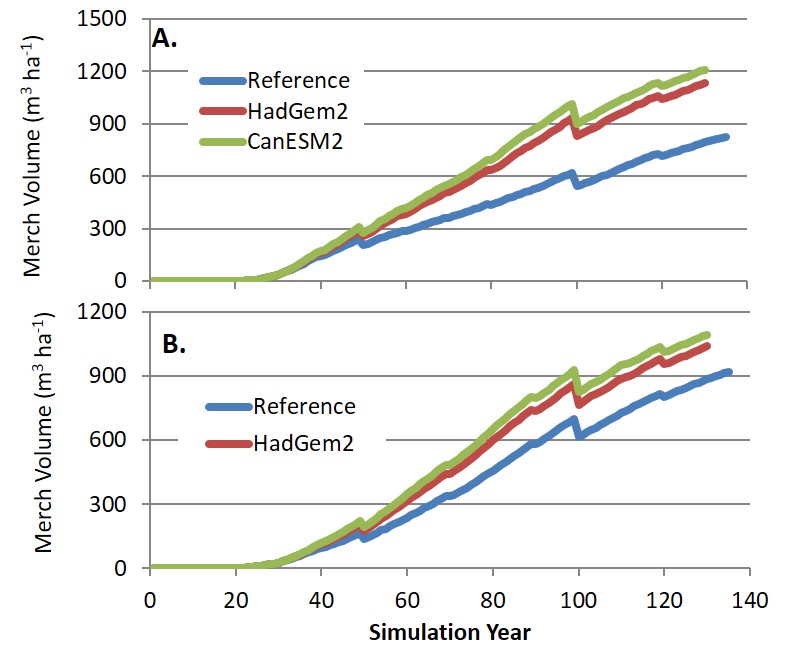
Figure 4: Simulation results from the MKRF pilot site showing the relative impact of 2 climate change scenarios on the long-term production of merchantable volume for A) Douglas-fir and B) western hemlock relative to the reference climate scenario.
Climate change also had a positive impact on site productivity through its impact on litter decomposition rates. The litter decomposition rate index increased substantially in both climate scenarios (Figure 5) causing increased litter N release (Figure 6), which in turn helped increase site productivity relative to the reference period. While the climate change simulations also showed a significant increase in drought-related mortality, the increase in site productivity more than offset the losses due to mortality.
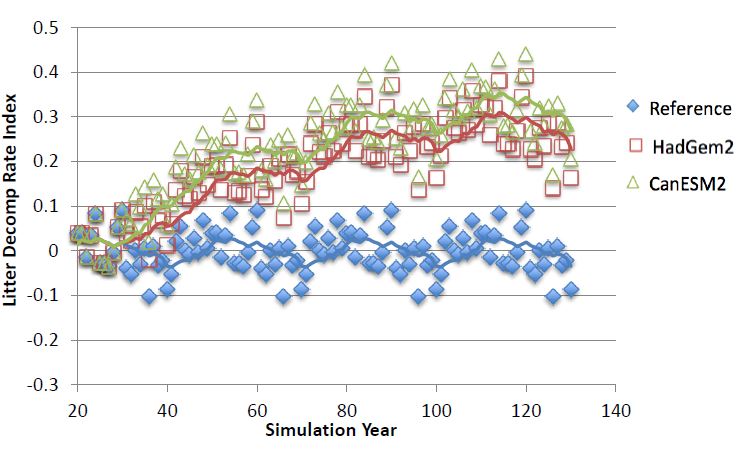
Figure 5: Simulation results showing the effects of climate change on the decomposition rate index. Results are shown for two climate change scenarios and the reference climate scenario. The lines represent 10-year moving averages.
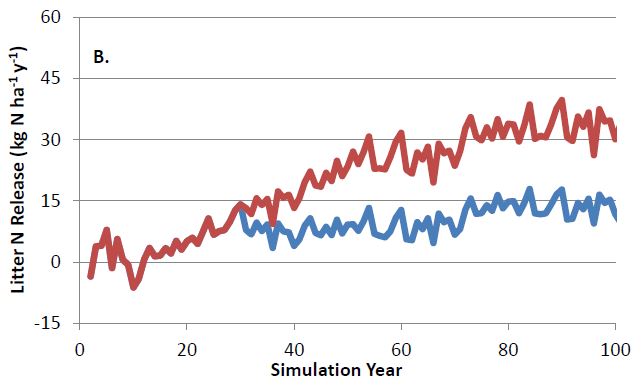
Figure 6: Simulation results showing litter N release for the CanESM2 climate change scenario (red) and the reference climate (blue).
Fujian Province
FORECAST Climate was applied in Fujian Province, China to simulate the stand-level impacts of four alternative climate change scenarios on the growth and development of Chinese fir plantations. Using the output of this model, a landscape-level analysis of the trade-offs between economic fibre production and ecosystem services in the context of climate change was conducted for a series of alternative management scenarios.
A Landscape Summary Tool was designed in Microsoft Excel to facilitate the calculation of indicators of ecosystem services. It works by dividing the whole project area into discrete analysis units and projecting the development of indicators in those units. The simulated age of each polygon within the landscape is used to model specific stand-level data, and is linked to a specific analysis unit. The nature of the linkage between FORECAST Climate and the LST model is shown in Figure 7. This tradeoff analysis will allow the best possible decisions to be made to achieve forest management targets and maintain healthy ecosystems under a changing climate.
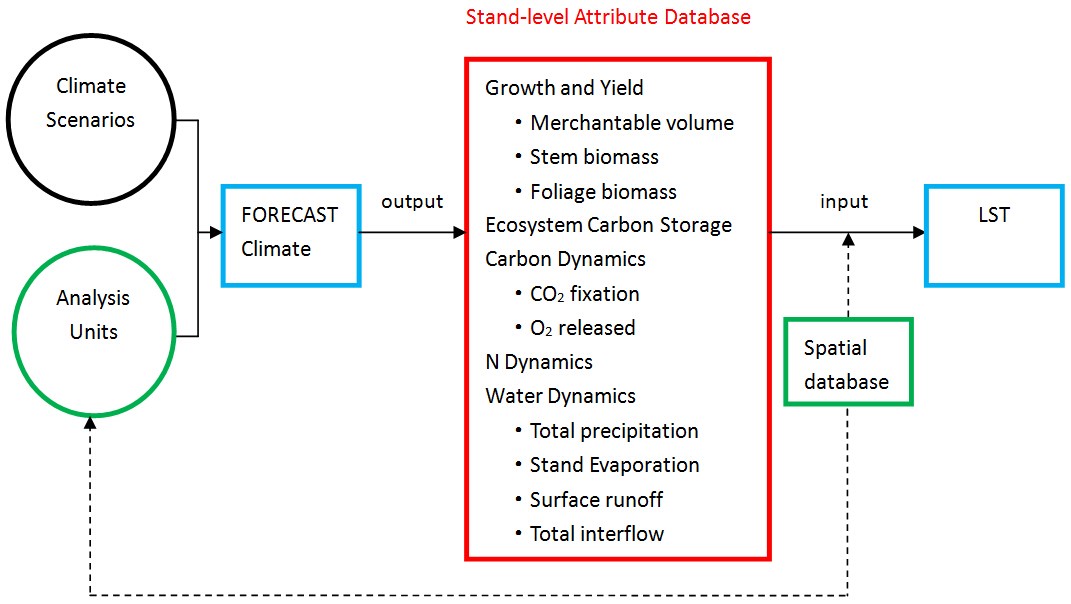
Figure 7: A schematic diagram illustrating the relationships and data transfer pathways between the FORECAST Climate and LST models.
The stand attribute database derived from FORCAST Climate was used to calculate values for specific indicators for the trade-off analysis. In this study, we used a series of metrics defined in a published Chinese report entitled “Specification for assessment of forest ecosystem services in China” (LY/T 1721-2008) to evaluate the flow of ecosystem services from the study area. In total we selected 9 indicators, 2 for economic production (volume harvested and biomass harvested), and another 7 for non-economic services.
Twenty-seven alternative management scenarios were developed using a factorial analysis approach (3 rotation length scenarios * 3 harvest retention options * 3 climate scenarios) (Figure 8). Employing the LST model, all 27 alternative management scenarios were explored over a 50-year time horizon. The absolute output values calculated for each of the indicators were converted to relative values (scaled from 0 to 1) to facilitate direct comparisons among indicators. We included a variable weighting decision approach to allow the users to determine the importance of each indicator. Through this, a total score based on the weighted sum of the indicators is calculated for each scenario to allow for a ranking of management options. Finally, a decision matrix output table was produced to illustrate the trade-off analysis results.
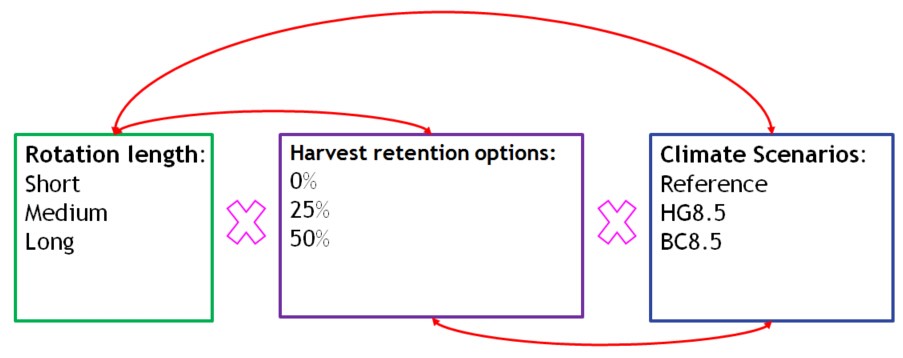
Figure 8: Combinations of rotation length, harvest retention and climate scenarios.
Results
Climate change was projected to have a smaller positive impact on the productivity of Chinese-fir plantations (5-7% over the reference climate) in the subtropical Fujian study area. Again, the increase in productivity was related to an increase in the length of the growing season. A sensitivity analysis was conducted to determine whether the results of the Fujian simulations would deviate significantly if the sensitivity of Chinese fir to elevated temperature was increased at mean daily temperatures above 20° C. We also examined the effects of increasing the sensitivity of Chinese fir to moisture stress. In both cases, the changes in parameters led to only small changes in the model output suggesting the model results are robust for the Fujian area.
Merchantable volume, stem biomass, total ecosystem carbon storage, N content, and pollutant absorption generally increased with stand age, while the rates of carbon fixation and oxygen released tended to decline with increasing age.The results show that stem biomass consistently accumulates more quickly than merchantable volume. Thus, the use of longer rotation lengths provides greater production of merchantable volume at the landscape-scale.
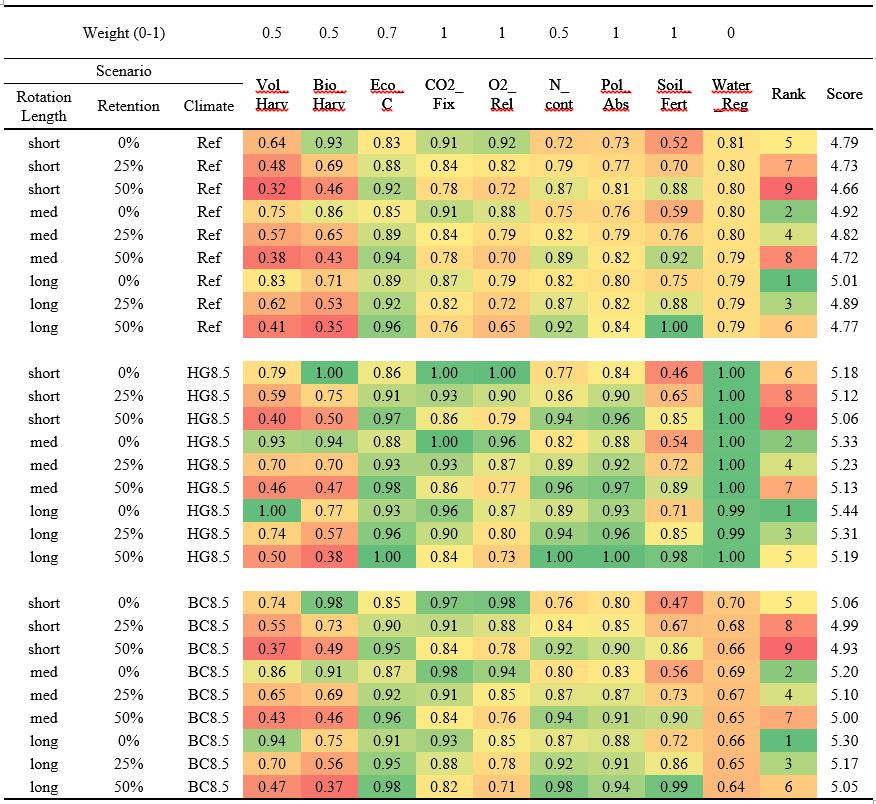
An example of the indicator output matrix generated by the LST for the study area landscape tradeoffs analysis is shown in Table 1. A total of nine indicators were calculated for each alternative management scenario and used to calculate a score based on the weighting factors assigned in the top row. We developed the LST as a decision-support tool for forest managers, as the output matrix allows the users to decide which management option is the best according to their determination of the importance for each indicator. The combination of weighting factors selected in the decision matrix shown in Table 1 resulted in the long rotation with no retention management combination being selected as highest-ranking scenario regardless of the future climate regime.
Table 1: Output from the LST model in the form of an indicator matrix with example weighting factors provided for each indicator. Nine scenarios with different retention levels and rotation lengths are grouped within each of the three different climate scenarios. The color scale ranges from green representing the highest-ranking scenario to red, representing the lowest ranking scenario.
Eco-Hydrological Modelling
The eco-hydrological model, DLM-Ecohydro (BEPS-TerrainLab V2.0), was developed from a Dynamic Land Model. This model is unique in that it integrates hydrology and ecology, which are most often looked at in isolation. This coupling generates a more accurate representation of movement of water through the physical environment and biological systems to generate a better understanding of the earth surface processes. It can be used to simulate annual mean temperature, evapotranspiration, soil water storage, surface and subsurface runoff, as well as gross and net primary production.
Results
This model was applied to the Fujian watershed study area in China and the Pitt Meadows watershed, which encompasses the MKRF pilot site in British Columbia to simulate the water balance and carbon cycle for a historical period (1980-2010) and future period (2010-2100) using different RCP scenarios. In Fujian, air temperature will increase 2-3 degrees C, with a higher temperature increase in valley areas (Figure 9). Differences in evapotranspiration between the two time periods was also observed (Figure 10).
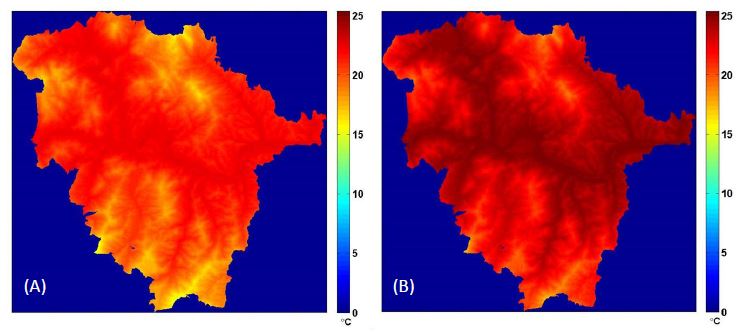
Figure 9: Simulated annual mean of daily temperature in A) 2010 and B) 2010 under RCP4.5 scenarios in Fujian watershed. Temperature was projected by 15 CHMIP models and downscaled by DLM-Ecohydro.
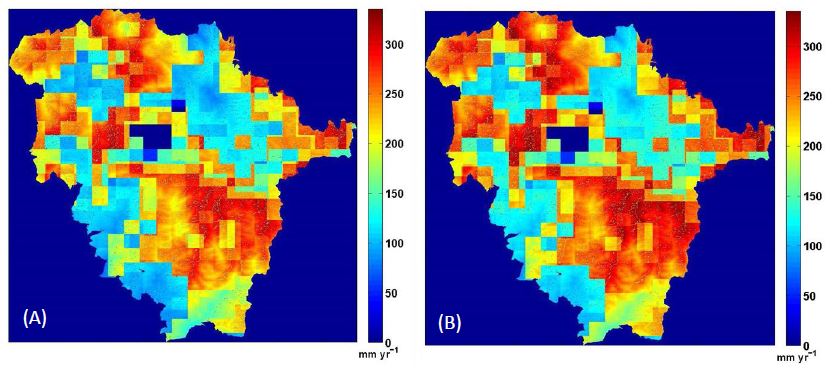
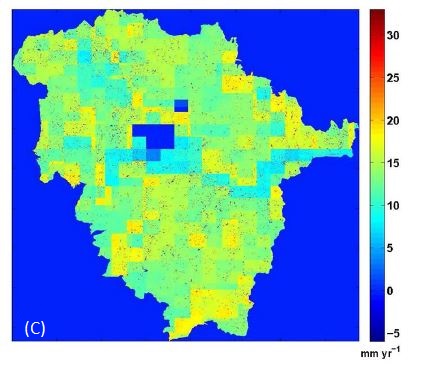
Figure 10: Simulated ET (mm/m2/year) under RCP4.5 scenario in (A) 2010, (B) 2100, and (C) the difference between 2100 and 2010 in Fujian watershed.
Ecosystem Carbon Dynamics
An analysis of ecosystem carbon dynamics under various climate change scenarios was done for the Pitt River Watershed (Figure 11), which encompasses the MKRF pilot site in British Columbia. The study area is located in coastal Western hemlock and mountain hemlock zones and is dominated by hemlock (56%), cedar (14%) and Douglas fir (12%).
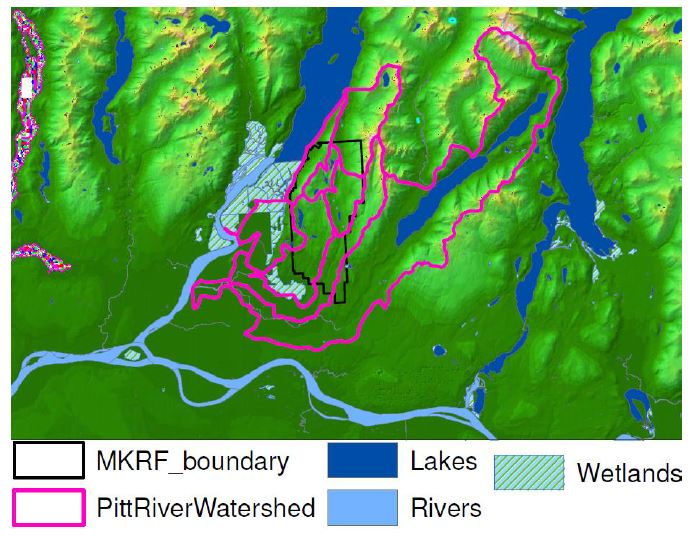
Figure 11: MKRF and adjacent watershed (Pitt River Watershed) selected as pilot site.
Several carbon indicators were modelled using a carbon budget model (CBM-CFS3) including carbon storage capacity, carbon pools size, carbon fluxes, and the capability of carbon exchange with the atmosphere. Forest managers can use this type of information in tradeoff analyses to compare and contrast different management regimes and determine the best approach for maintaining stable carbon stock and achieving sustainable timber harvesting.
This model also projected carbon fluxes for the Pitt River watershed to determine if the region will become a carbon source or sink in the future. This highlights any potential risk of the forest becoming a source of carbon and enables forest managers and policy makers to take proactive measures to return it to a carbon sink.
Model Integration for Decision Making
Objective 1: The overall objective of this research was to assemble existing science, technology, and essential tools to help managers and decision makers make sound decisions on sustainable forest management under the changing climate. There are numerous tools/models used in SFM, strategic planning, and scenario testing to assist high-level decision-making. We explored the potential implications of these models in the Asia-Pacific with the expectation that some of these tools would be adopted by other regions to solve local management issues in a cost-effective manner (Table 2).
Table 2: A summary of the modelling tools employed within the pilot studies.
| Model | General Applications | APFNet sites | Spatial Scale | Climate Change |
Climate data | Potential Links | References |
| FORECAST Climate | Forest productivity, growth and yield, forest carbon dynamics, soil fertility, resource trade-off analysis | Coastal BC, Canada; Fujian, China | Stand | Yes | Daily | TACA, LST, Patchworks | Seely et al. 2014 |
| Tree and Climate Assessment tool (TACA) | Species composition, regeneration | Central Highlands, Australia | Stand | Yes | Daily | FORECAST Climate, LANDIS-II | Nitschke and Innes 2008 |
| 3-PG | Forest productivity | Mainland China | Stand to medium landscape | Yes | Monthly | LST | Landsberg and Waring. 1997 |
| Carbon Budget Model (CBM-CFS3) | Forest carbon dynamics | Coastal BC, Canada | Stand to regional | No | N/A | Patchworks | Kurz et al. 2009 |
| Landscape Summary Tool (LST) | General framework for scaling up stand-level model output, Resource trade-off analysis | Fujian Province | small landscape | Yes1 | FORECAST Climate; 3PG | Kang et al. 2016 | |
| LANDIS-II | Species composition, succession | Central Highlands, Australia | small to medium landscape | Yes1 | Monthly | TACA | Scheller et al. 2007 |
| BEPS-TerrainLab v.20 | Forest hydrology and related biogeochemical processes | Coastal BC, Canada; Fujian, China | small landscape | Yes | Daily | Govind et al. 2009 | |
| Patchworks | Forest planning, growth and yield, natural disturbance | Coastal BC, Canada | small to medium landscape | No | N/A | FORECAST Climate, CBM-CFS3 | Lockwood and Moore, 1993 |
| Climate AP & Web tools | Spatial downscaling of climate change data | Asia Pacific Region | medium to regional | Yes | Monthly | FORECAST-Climate; 3PG, TACA | http://climateap.net/ |
| Climate AP & Niche models | regional, species-specific, climate suitability analysis | Asia Pacific Region | medium to regional | Yes | Monthly | Wang et al. 2016 |
Objective 2: Another objective of the study was to develop a set of indicators for which SFM can be successfully evaluated under climate change. We selected 7 indicators for our study region as major indicators that might have a greater response to climate change. Those indicators include: 1. Changes in area of forest distribution, 2. Changes in major climate variables, 3. Suitable species habitats, 4. Total growing stocks, 5. Area of forest disturbed by causes (naturally climate related), 6. Net change in forest ecosystem carbon, and 7. Forest ecosystem carbon storage.
The multi-value trade-off analysis framework for strategic decision making and planning was then employed at the MKRF pilot site in British Columbia to explore and understand the tradeoffs of multiple management scenarios (Figure 12). This framework is able to assess the impacts of different forest management regimes on ecosystem values, evaluate the influence of alternative management strategies on these values and their tradeoffs, as well as address some of the complex effects of climate change on the ecosystem and decision making process. There were three main components of this framework; the first component was the appropriate indicators and their models, which were the seven climate related indicators designed to be representative of key forest management objectives.
The second component, an essential part of the framework, was the multiple values trade-off analysis framework for strategic decision-making and planning. All the values/indicators selected or management objectives were formulated in a way that the (sub)-optimal solutions would be achieved through balancing or trading off one value for another/others. The uniqueness of this framework is that the managers or practitioners can quantitatively determine when he/she makes one choice verse another, and what gains or losses they have to face.
The final component of this integration was to present information in a simple way to let common users understand the key points is a challenging task that many researchers are currently facing. In our framework, we present the results by using simple and intuitive risk classes to assist managers, practitioners, and even general stakeholders to understand the complex forest management issues. It also helps to provide insight as to how the issues were addressed, and the nature of the compromises that must be made when dealing with these issues. Although this framework was applied in Canada, these tools can be used in other Asia-Pacific location.
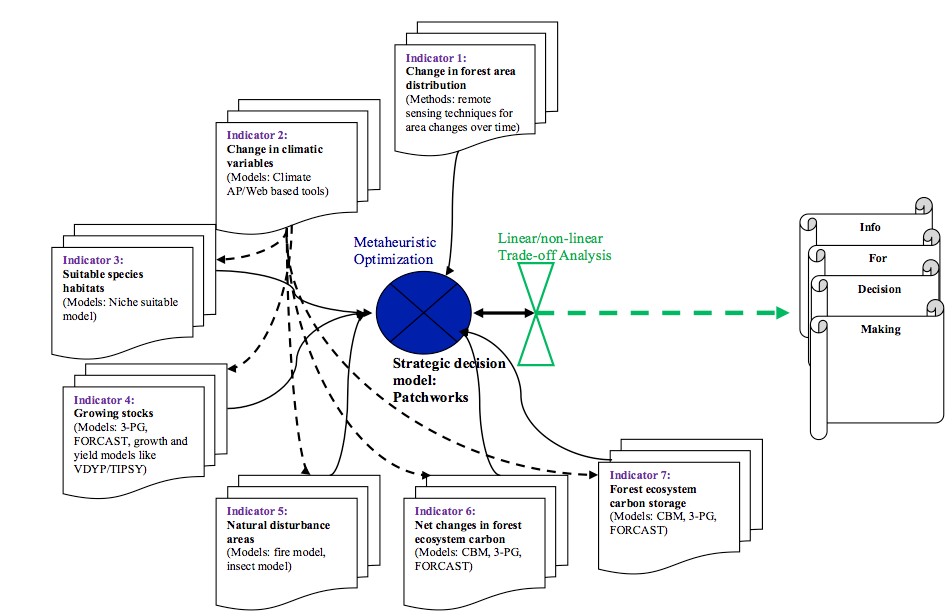
Figure 12: A conceptual flow diagram of the indicator-based decision-support framework.
This model integration framework provides a tool for forest managers to determine the best management strategies to achieve SFM objectives in the context of climate change. It considers broad objectives, such as conserving biodiversity, combating climate change, carbon storage capacity of forests, and respecting aboriginal culture and rights, as well as more standard objectives such as timber volume and revenue. The trade-off analysis is complex enough to be used by those who are very skilled in this type of analysis and have access to detailed information, but is also simple enough to be used by those with less experience and less complex information. This framework provides managers and decision makers with straightforward methods to quantify the individual or combined benefits and tradeoffs of multiple, potentially conflicting objectives.
Publications
Kang, H., Seely, B., Wang, G., Innes, J.L., Zheng, D., Chen, P., Wang, T., and Li, Q. (2016). Evaluating management trade-offs between economic fiber production and ecosystem services in the context of climate change in a Chinese fir dominated forest plantation in Fujian Province. Science of the Total Environment, 557-558: 80-90.
Kang, H., Seely, B., Wang, G., Innes, J.L., Zheng, D., Chen, P., Wang, T., and Li, Q. [In Review]. Simulating the impacts of climate change on growth of Chinese fir plantations in Fujian Province, China.
Kang, H., Wang, T., Wang, G., Innes, J.L., Zheng, D., Chen, P., Seely, B., and Li, Q. [In Review]. Application of climate niche approach to project future distribution of Chinese fir and its adaptation strategies under changing climate in Fujian Province.