
Physiological Principles to Predict Growth
The process-based, stand-level growth model, Physiological Principles to Predict Growth (3-PG) was used to explore biophysical and bio-physiological interactions influencing the stand dynamics of a given species to assess the impact of climate change on habitat loss. It is a simplified stand level, single species growth model, applying well-established physiological equations and constants to the species of interest. Model inputs include 1) monthly summarized climate data of maximum/minimum temperature, number of frost day, mean precipitation, and solar radiation, 2) parameterized species physiological attributes, 3) site variables. The 3-PG model, based on these inputs, estimates the climate modifiers from which both the stand productivity and the distribution of a tree species of interest can be predicted.
Chinese Fir
Application
For this study, the 3-PG model was applied to Chinese fir in the regions of southern China to assess the impacts of climate change on species distribution and productivity. Current and future climate scenarios were generated by ClimateAP using IPCC AR4 GCMs. 3-PG was applied to model species distribution and productivity for a 20-year period. Stand volume and Net Primary Production (NPP) were analyzed to represent productivity; the species distribution model was used to limit the analysis to locations where Chinese fir was predicted to be present. Further detail on the methods and application can be found in Lu et al. 2015b.
Results
Modelled distributions under climate scenarios A1B and A2 suggest a northward shift with central China likely to become more suitable for Chinese fir (Figure 1). However, predicted productivity for the expanded areas were very low, which was in agreement with niche-based model predictions.
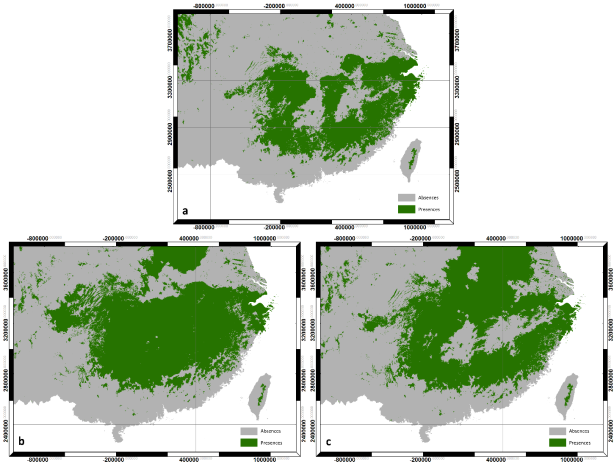
Figure 1: Graphic representation of modelled Chinese fir distribution under different climate scenarios. a) current; b) A1B; c) A2
Net primary production (NPP) was also calculated in this study. Figure 2 shows the percent changes between the baseline (current) and two climate scenarios. Although changes in NPP are more profound in scenario A1B (Figure 2a), both scenarios indicate a NPP in southern China but an increase (>50%) in central China.
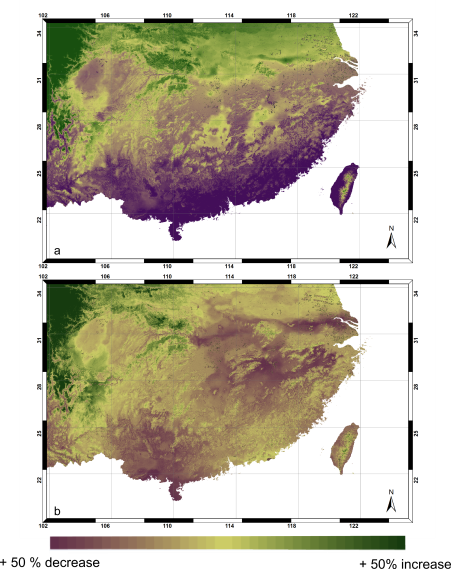
Figure 2: Percent changes in NPP between baseline and scenario. a) A1B; b) A2.
This knowledge on predicted changes in distribution and productivity of Chinese fir will benefit forest managers, particularly those managing plantations. It will allow them to match species to be planted to the regions expected to be within their distribution. This type of planning will allow for long-term sustainability of the forest ecosystems and continued economic benefits from the industry.
Further detail on the results of this study can be found in Lu et al. 2015b.
Significance of 3-PG Application to Chinese fir
The application of 3-PG was successful in accomplishing the primary objective of assessing the impact of climate change on Chinese fir, specifically in regards to stand productivity and species distribution. The casual-effects relationship derived from the 3-PG model can be used to enhance our understanding of the reasons for habitat loss. Even more in-depth knowledge of the potential shift in species distribution can be achieved when coupled with the niche-based models. Understanding and quantifying the potential climate change impacts on tree species will aid forest managers at the local scale in developing management strategies that are best suited to the future climates, especially those managers working with plantation species. At the provincial or national level, distribution patterns and forest productivity will assist policy makers in generating more accurate and scientific-based policies.
Douglas Fir
Application
In this study, we used data derived from 3-PG model and LiDAR remote sensing to assess regional stand volume of Douglas fir dominated stands in Malcolm Knapp Research Forest (MKRF) in British Columbia, Canada. 3-PG was used to predict gross and merchantable volume across the region, using spatial estimates of climate variables. In doing so, we assessed the relative constraints exerted by climate on Douglas fir growth. Additionally, LiDAR was used to estimate stand volume over the same stand area. Predictions of stand volume where then compared and contrasted to assess the relative benefits and drawbacks of each approach. Further detail on the methods and application can be found in Lu et al. 2015a.
Results
There was no difficulty in matching 3-PG predictions of volume to field measurements (Figure 3) with r2 = 0.91 for 19 plots using correlation coefficient with a slope not significantly different from a 1:1 line (p < 0.05).

Figure 3: 3-PG predicted vs observed net stem volume for 19 stands within the MKRF (m3/ha)
The relationship between LiDAR metrics and stem volume was also clear (R2 = 0.70) (Figure 4).
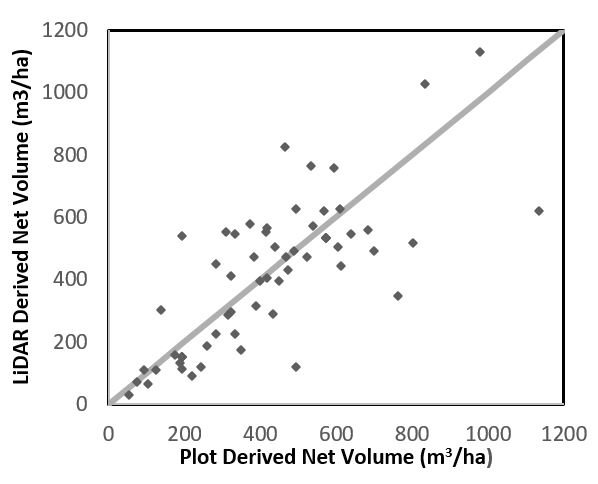
Figure 4: LiDAR Predicted vs observed net stem volume for 62 stands within the MKRF.
A comparison of stem volume as predicted by LiDAR and 3-PG is shown in Figure 5, and shows a strong relationship for inventory polygons that were dominated by Douglas fir and have a canopy closure of >80% as computed from the LiDAR coverage.
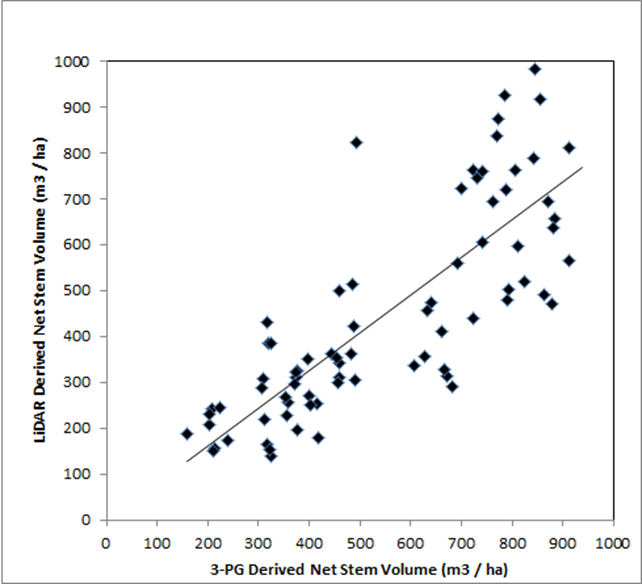
Figure 5: Comparison between LiDAR derived and 3-PG modelled net stem volume for inventory polygons dominated by Douglas fir with over 80% canopy cover.
Empirical growth models and site index tables, which are most often used by foresters, are not well designed to adapt to growth changes under a changing climate, principally as these approaches are derived from past growth, and can only project future growing conditions similar to those in the past. Under a drying climate, 3-PG could be used to simulate future yields, the likely spatial pattern of drought stress, and the benefits of some potential adaptive measurements such as reduced stocking, silvicultural treatment, or planting of other more drought tolerant species.
The LiDAR based estimation of stand volume also provided useful predictions, which can complement field-based inventories by providing high spatial resolution sampling of forest structure. LiDAR derived inventories can assist in forest management decisions and planning as well as report on carbon storage and sustainable management practices in managed forests.
Further detail on the results of this study can be found in Lu et al. 2015a.
Significance of 3-PG and LiDAR Application to Douglas fir
There are a number of benefits to utilizing both a process based and a LiDAR derived estimate of stand volume. At locations where LiDAR exceeds the 3-PG predictions this may indicate an incorrect stand age in the database, the application of some silvicultural treatment such as fertilizer, or stand level thinning where a growth response has occurred. In contrast when LIDAR predicts stand volumes less than what is predicted by 3-PG this may be indicative of a disturbance, which in this type of forests could be Douglas-fir beetle or other types of defoliators, root rot, or abiotic disturbances such as snow damage or wind throw. Coupling of these two methods can generate highly accuracy information, allowing the best possible forest management strategies to be developed.
Fire Management Under a Changing Climate
Forest fire is a crucial disturbance factor for forest ecosystems. Studies have shown that climate change has greatly changed the fire regime and frequency in some forest ecosystems, particularly in the boreal forest. With this research, we attempted to understand the relationship between climate change and forest fire as a means to identify to response of forests to future climate change. Additionally, we aimed to determine the most appropriate models to identify the relationship between forest fire properties and potential influence factors, so as to improve the accuracy of analysis on the relationship between climate factors and forest fire properties such as frequency, burned area, spatial patterns, etc. Additionally, we analyzed the spatial pattern and driving factors that impacted forest fires in the Chinese boreal forest.
Overall, there were four main objectives to our examination of fire management under climate change: 1) identify the model most appropriate to examine the relationship between forest fire occurrence and climate factors; 2) identify a suitable model to examine the relationship between area burned by forest fire and climate factors; 3) determine the spatial and temporal patterns of historical forest fires and analyze the cause of the patterns; and 4) estimate carbonaceous gas emissions from forest fires to better understand the significance of forest fires in calculating carbon emissions and forecasting climate change. The focal point for all of these research objectives was the boreal forest of Daxing’an Mountains, China (Figure 6).
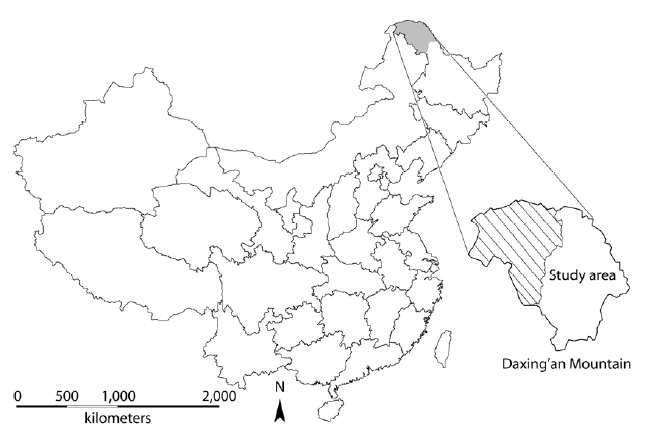
Figure 6: Daxing’an Mountains, China. Study area
1) Model identification: Fire occurrence
Application
Researchers and resource managers need suitable models that can reflect the relationship between forest fire occurrence and climate factors in order to more accurately predict fires and develop realistic fire prevention and land management strategies. As such, this project compared six generalized linear models to determine which was best suited to examine the relationship between the occurrence of lightening-induced forest forests and meteorological factors in the Northern Daxing’an Mountains of China.
The six models included Poisson, Negative Binomial (NB), Zero-Inflated Poisson (ZIP), Zero-Inflated Negative Binomial (ZINB), Poisson Hurdle (PH), and Negative Binomial Hurdle (NBH) models. Goodness-of-fit was compared and tested among the six models using Akaike Information Criterion (AIC), sum of squared errors (SSE), likelihood ratio test (LRT), and Vuong test. The predictive performance of the models was assessed and compared using independent validation data by a data-splitting method. Further detail on the methods and models used can be found in Guo et al. 2016.
Results
The ZINB model proved to be the most suitable model for fitting the monthly occurrence of lightning-induced forest fires in Daxing’an Mountains, as compared to traditional approaches, such as multiple linear regression, Poisson regression, etc. Generally speaking, to some extent the data structure influences the model application. Therefore, the most suitable model can differ if the data structure of fire occurrence changes; monthly fire occurrence data was used for this study. For more information on the results of this research, please see Guo et al. 2016.
2) Model identification: Burned area
Application
This research focused on determining a suitable model for investigating the effects of climate factors on the area burned by forest fire in Daxing’an Mountains, China. Three regression models were applies to determine the relationship between climate variables and the area burned by lightning-caused fires, human-caused fires, and the combinations of both.
The three models used were a multiple linear regression model, a log-linear regression model, and a gamma-generalized linear model. The response variables were the burnt area by lightning-caused fire, human-caused fire, and total burned area; the predictor variables were nine climate variables collected from the local weather station. The goodness-of-fit of the models was evaluated and compared using model statistics such as R2, AIC, and root mean square error (RMSE). Further information on the methods and models used can be found at Guo et al. 2015.
Results
The results revealed that the gamma-generalized linear model was generally superior to both the multiple linear regression model and log-linear model for fitting the fire data. This was especially true for the human-caused and total burned area. Furthermore, the best models were selected based on the criteria that the climate variables were statistically significant at α = 0.05. The gamma model best indicated that maximum wind speed, precipitation, and days with rainfall greater than 0.1mm had significant impacts on the area burned by the lightning-caused fire, while the mean temperature and minimum relative humidity were the main drivers of the area burned by human activities. Overall, the total area burned by forest fire was significantly influenced by days with rainfall greater than 0.1mm and minimum relative humidity, indicating that the moisture conditions of forest stands determine the area burned by forest fire.
The R2 of all models were less than 0.4, meaning that these models can only explain a limited percent of the total variation in the three response variables. As such, these nine climate variable may not be sufficient to predict the area burned by forest fire; other factors such as forest type, topography, infrastructure, or human-activities may also significantly influence the fire burned area. For more information on the results of this research, please see Guo et al. 2015.
3) Determine patterns of historical forest fires
Application
Another component of the research was to determine the spatial and temporal patterns of historical forest fires in the Chinese boreal forest and analyze the causes of the patterns. As well, a prediction model was used to determine forest fire risk in the Chinese boreal forest, which takes into account several comprehensive factors, including climate variables, terrain, forest types etc.
In this study, K-function and Kernel density estimation were used to analyze the spatial pattern of human-caused fires using S-plus and ArcGIS, respectively. The analysis of driving factors was performed in SPSS 19.0 based on a logistic regression model. The variables used to identify factors that influence fire occurrence included vegetation types, meteorological conditions, socio-economic factors, topography and infrastructure factors, which were extracted through the spatial analysis mode of ArcGIS and collected from official statistics. A logistic regression model was also developed to predict the likelihood of human-caused fires and identify the most influential variables in explaining the spatial pattern of fire occurrence. Further information regarding methodology can be found in Guo et al. 2014.
Results
The annual number of human-caused fires and the area burnt has declined since 1987 due to the implementation of a forest fire protection act (Figure 7). There was significant spatial heterogeneity (Figure 8) and seasonal variations (Figure 9) in the distribution of human-caused fires in the Daxing’an Mountains. The heterogeneity was caused by elevation, distance to the nearest railway, forest type, and temperature. A logistic regression model was developed to predict the likelihood of human-caused fire occurrence in the Daxing’an Mountains; its global accuracy attained 64.8%. The model was thus comparable to other relevant studies.
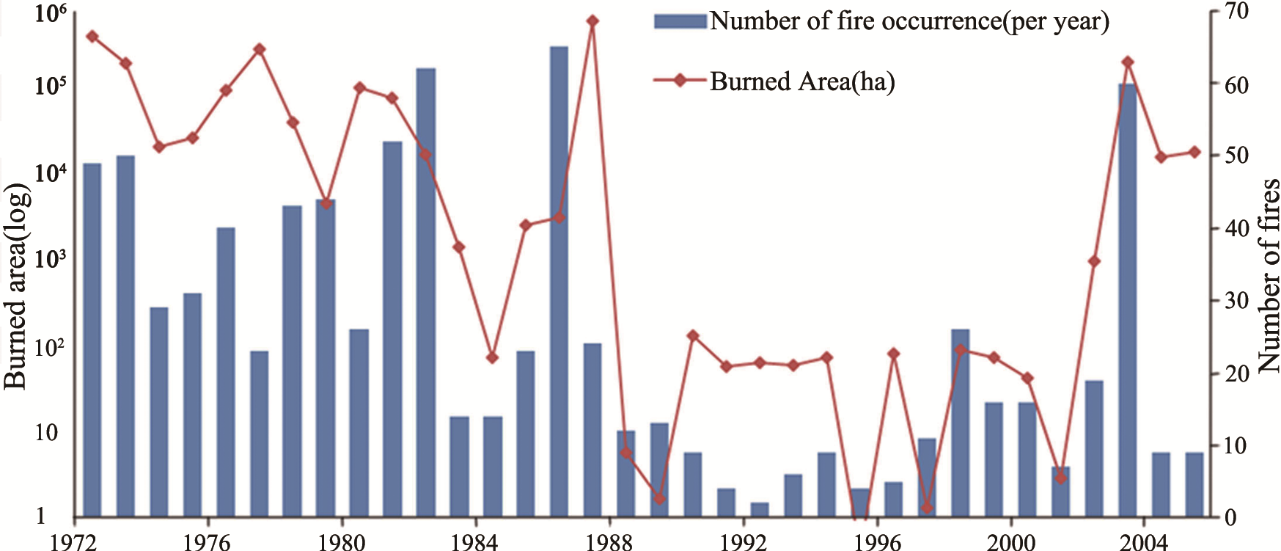
Figure 7: The annual burnt area and human-caused fire frequency in Daxing’an Mountains during 1972-2005.
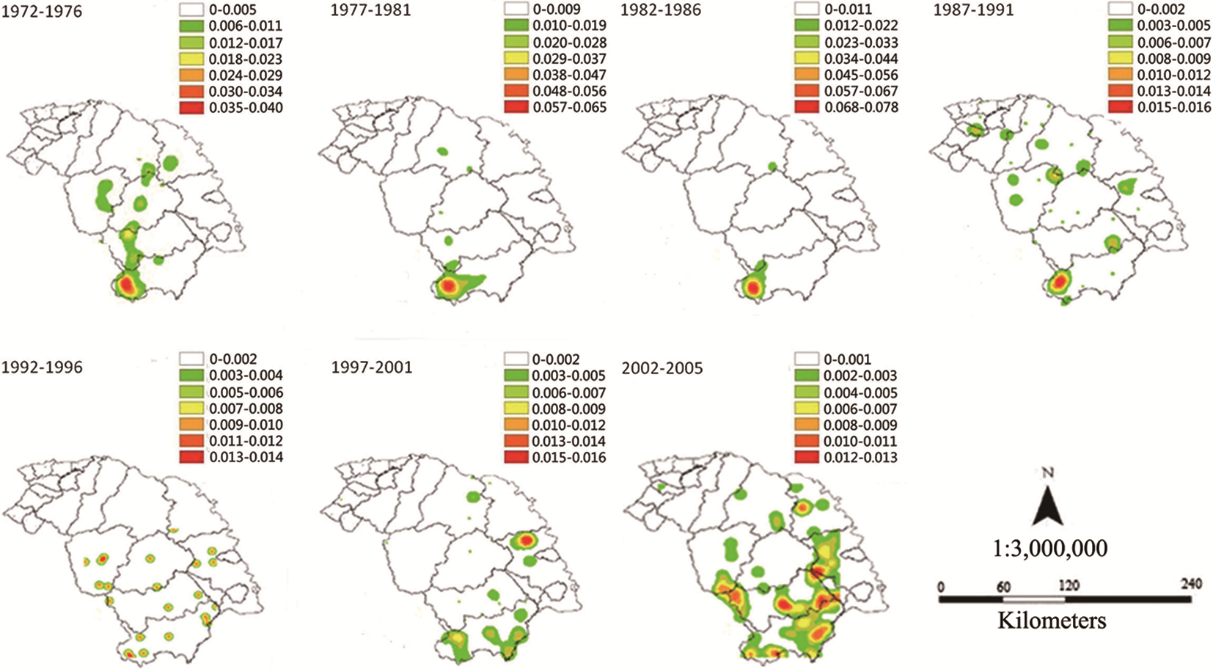
Figure 8: Spatial intensity of human-caused fires in Daxing’an Mountains during 1972-2005 with five-year time interval. The intensity represented the number of human-caused fires per square kilometer based on 50 km bandwidth scale.
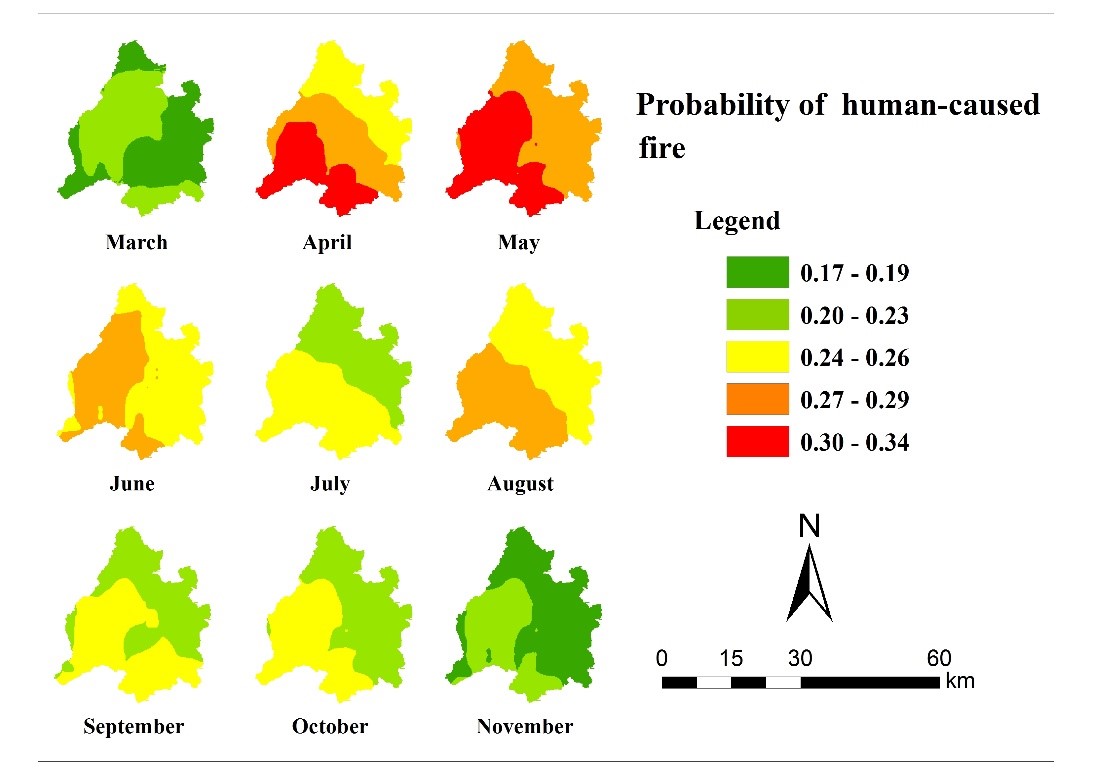
Figure 9: The human-caused fire risk of Tahe (located in Daxing’an Mountains in the Chinese boreal forest) during the fire season of 2015 based on the prediction model.
Objective 4: Wang et al. 2016 – Gas emissions
4) Estimate gas emissions from forest fires
Application
Forest fire is a prominent disturbance factor in many forest ecosystems plays an important role in atmospheric chemical cycles and the carbon cycle. Emissions from wildland fires are a significant source of carbonaceous aerosols, CO, greenhouse gases (CO2, CH4) and a diversity of other gases, including nonmethane organic compounds (NMOC). The aim of this research was to provide an integrated approach for calculating gas emissions from forest fires, which can then be used to calculate forest carbon balance, model global climate change, and contribute to understanding other important issues such as fire ecology and managing forest fires.
This study estimated the gaseous emissio from 2006 Kanduhe forest fire in… This study uses images from Enhanced Thematic Mapper Plus (ETM+) on the Earth-observing satellite LANDSAT-7 for the year 2005 to estimate the total gases emitted by the 2006 Kanduhe forest fire in the Daxing’an Mountains. The burned area was identified based on remote sensing data such as vegetation indices, and categorized into three burning intensities (heavy, moderate, and light burning). The forest are was also classified into larch, broadleaf, mixed broadleaf-conifer, and shrubs. Further information on the methods and application can be found at Wang et al. 2016.
Results
Our results suggest that the fire in Kanduhe emitted approximately 149,187.66 t CO2, 21,187.70 t CO, 1925.41 t CxHy, 470.76 t NO and 658.77 t SO2. The moderate intensity fire resulted in the highest emissions of carbon containing cases, NO, and SO2 within the same forest type. Within any given fire intensity, the broadleaf-conifer mixed forest emitted the most carbon-containing gases. Larch forest contributed the most NO and SO2 under the same fire intensity. For more information on the results of this research, please see Wang et al. 2016.
LiDAR
Remote sensing techniques can provide quantitative spatially explicit information and “wall-to-wall” observations for carbon stock mapping and monitoring. Light Detection and Ranging (LiDAR) is an active airborne remote-sending laser technology capable of providing detailed, spatially explicit, three-dimensional information on vegetation structure. A large number of studies have demonstrated the potential of LiDAR to accurately estimate biophysical and structural properties over a wide range of forest types.
This research was conducted at Yushan Forest in southeastern China. The objectives of this research included: 1) mapping above- and below-ground biomass components in subtropical forests using small-footprint LiDAR components in subtropical forests and 2) using small-footprint discrete and full-waveform airborne LiDAR metrics to estimate total biomass and biomass.
Mapping above- and below-ground biomass
Application
This research used small-footprint LiDAR to estimate biomass components in subtropical forests in southeastern China’s Yushan Forest. The objectives were 1) to build models for above- and below-ground biomass components for forest plots in three subtropical forest types (i.e. mixed, broadleaved, and coniferous forests) using LiDAR data, and to assess the impact of forest type on the accuracy of the regression model; and 2) to map the above- and below-ground forest biomass components across the site using LiDAR data and evaluate the accuracy using a suite of independent stand-level inventory data.
A total of 53 30×30 m (900 m2) plots were established within the study site, covering a range of species composition, age, and site index, according to a GIS-based historical forest inventory map (2005). These plots were divided into three forest types based on species compositions: 12 coniferous forest plots, all dominated by Masson pine and Chinese fir; 18 broad-leaved forest plots dominated by Sawtooth oak and Chinese sweet gum, and 23 mixed species forest plots with a mixture of coniferous and broad-leaved species were measured for this study. Airborne laser scanner data were acquired on August 17th in 2013 using a Riegl LMS-Q680i flown at 900m above ground level. LIDAR metrics are descriptive structure statistics calculated from the raw LiDAR point cloud.
Further detail on the methods and application can be found in Cao et al. 2014b.
Results
The fit for the common, generic model, for all stands, irrespective of dominant species was relatively low (R2 = 0.26–0.63). In comparison, the relationship were generally improved for individual models based on dominant species (R2 = 0.21–0.84). In general, the fitted models had higher correlations in coniferous forest (R2 = 0.80–0.84) than in other forest types. The results for the biomass components indicated that root biomass in coniferous forest (R2 = 0.83) was well predicted, whereas models for root biomass in broadleaved forests (R2 = 0.53) and mixed (R2 = 0.64) had a slightly lower level of significance.
We found that LIDAR-based biomass predictions fit the stand-based biomass estimates well overall in the 45 reference stands for most of the biomass components with relationships close to the 1:1 line. The mean value of individual components for each sample plot are illustrated in Figure 6. Coniferous-dominated forests contributed high biomass in areas with good site quality (e.g., forest dominated by Masson pine in some valleys with thick soil layers) and relatively flat areas (e.g., stands dominated by Slash pine at the foot of southern part of the study area). There was a relatively large area of lower biomass, especially root biomass, in the northwest–central part of the study area, reflecting the presence of low-quality Chinese fir plantations on ridge tops with poor site quality and some agroforestry plantations (Chinese fir accompanied by tea) with large canopy gaps and low stem density.
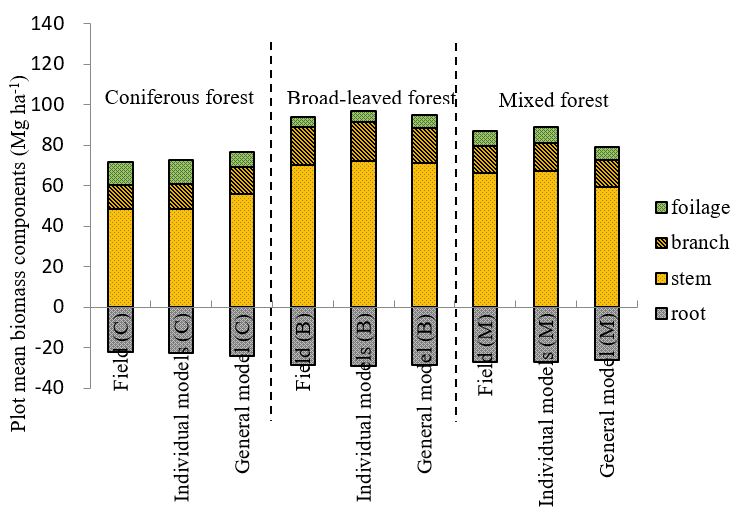
Figure 6: Mean value of the biomass components (Mg/ha) of the 53 sample plots from 1) field measurements; 2) estimations of the dummy variable including stepwise regression model; and 3) predictions of the general models of three forest types, i.e. coniferous, broadleaved, and mixed forests.
Overall, small-footprint LiDAR can be used efficiently to estimate the amount of biomass components in subtropical forests. Forest type-specific models represent improved performance over the general model. Results vary between forest types; in this study, the most accurate results were obtained for coniferous stands in homogeneous forest conditions. In addition, some of the canopy height and cover metrics applied (previously used in temperate, boreal and tropical forests) appear to be useful in estimating biomass in subtropical forests such as those in southeastern China. This research illustrates the potential for LiDAR as a technology to assess subtropical forest carbon accurately, and to provide a better understanding of how forest ecosystems function in this region.
Further detail on the results can be found in Cao et al. 2014b
Estimating total biomass and biomass components
As a primary reservoir of carbon dioxide (CO2) in terrestrial ecosystems, forests play a key role in the global carbon cycle. The partitioned biomass components (i.e., trunk, branch, foliage and root) provide important information for forest management decisions such as the estimation of stem and branch biomass for biofuels calculations, as well as analysing foliage biomass for studying forest growth and assessing crown biomass (i.e., branch and foliage biomass) for predicting fire hazard.
In this research, we examined the relationship between forest biomass (i.e., above-ground and total biomass) and its components (i.e., foliage, branch, trunk and root biomass) with small-footprint discrete (DR) and full-waveform (FW) airborne LiDAR derived metrics in three typical subtropical forest types (i.e., coniferous, broadleaved, and mixed forests). In addition, we examined the estimation capability of DR and FW metric based models for biomass estimation individually and in combination. Finally, the accuracy of the relationships was evaluated within each forest type by comparing biomass estimates with field measurements, which were then used to characterize the environments using additional topographic and vegetation conditions.
Application
Using historical discrete return airborne LiDAR data (2007), a mean height and a cover layer at 30 m cell resolution was developed to be used as an initial stratification of the study area. The height and canopy layers were classified into five equal interval classes in combination with the GIS-based forest inventory data (2012) to guide the selection of ground sample plot. A total of 65 square plots (30 × 30 m) were established within the study site, covering a range of species composition, age classes, and site indices. The LiDAR Data was obtained by the same means as mentioned above, but used two different techniques focusing on (i) 3-D canopy structural information by discrete (XYZ) LiDAR metrics (DR-metrics), and (ii) the detailed geometric and radiometric information of the returned waveform by full-waveform LiDAR metrics (FW-metrics). This was done to evaluate the capacity of these metrics in predicting biomass and its components in subtropical forest ecosystems. Further detail on the methods and application can be found in Cao et al. 2014a.
Results
The results indicated that three sets of predictive models performed well across the different subtropical forest types (Adj-R2 = 0.42–0.93, excluding foliage biomass). Forest type-specific models (Adj-R2 = 0.18–0.93) were generally more accurate than the general model (Adj-R2 = 0.07–0.79) with the most accurate results obtained for coniferous stands (Adj-R2 = 0.50–0.93). In addition, LiDAR metrics related to vegetation heights were the strongest predictors of total biomass and its components. This research also illustrates the potential for the synergistic use of DR and FW LiDAR metrics to accurately assess biomass stocks in subtropical forests, which suggests significant potential in research and decision support in sustainable forest management, such as timber harvesting, biofuel characterization, and fire hazard analyses. Further detail on the results can be found in Cao et al. 2014a.
Publications
Cao, L., Coops, N.C., Hermosilla, T., Innes, J.L., Dai, J., and She, G. (2014a). Using small-footprint full-waveform and discrete-return airborne LiDAR data to estimate total biomass and biomass components in subtropical forests. Remote Sensing, 6(8), 7110-7135.
Cao, L., Coops, N.C., She, G., and Dai, J. (2014b). Mapping above- and below-ground biomass components in humid subtropical forests using small-footprint LiDAR. Forests, 5(6), 1356-1373.
Guo, F., Wang, G., Innes, J.L., Ma, X., Sun, L., and Hu, H. (2015). Gamma generalized linear model to investigate the effects of climate variables on the area burned by forest fire in northeast China. Journal of Forestry Research, 26(3): 545-555.
Guo, F., Wang, G., Ma, Z., Innes, J.L., and Ma, X. (2016). Comparison of six generalized linear models for modeling the occurrence of lightening-induced fires in northern Daxing’an Mountains, China. Journal of Forestry Research, 27(2): 379-388.
Guo, F., Innes, J.L., Wang, G., Ma, X., Sun, L., Hu, H., and Su, Z. (2014). Historic distribution and driving factors of human-caused fire in the Chinese boreal forest during 1972-2005. Journal of Plant Ecology, DOI: 10.1093/jpe/rtu041.
Lu, Y., Coops, N.C., Bolton, D.K., Wang, T., and Wang, G. (2015a). Comparing stem volume predications of coastal Douglas-fir stand in British Columbia using a simple physiological model and LiDAR remote sensing. Forest Science, 61 (3): 586-596.
Lu, Y., Coops, N.C., Wang, T., and Wang, G. (2015b). A process-based approach to estimate Chinese Fir (Cunninghamia lanceolata) distribution and productivity in southern China under climate change. Forests, 6(2), 360-379.
Wang, Q., Guo, F., Hu, H., Sen, J., and Su, Z. (2016). Estimation of gases emitted by forest fires based on remote sensing data. Journal of Forestry Research, 27(2): 369-378.