
Pilot site experiments are used to help develop long-term adaptive management strategies and identify the social, economic and environmental impacts of forest adaptation options. Through integration of model predictions with local forest management practices, we identified areas where existing tree populations will become vulnerable in the future and areas that will be suitable for planting new species. For Phase I, this analysis took place at a series of test sites located in China, Australia, and North America (Figure 1). A similar application of models will be done in Phase II to sites in Malaysia, Myanmar, Laos, China, and Chinese Taipei (Figure 2). 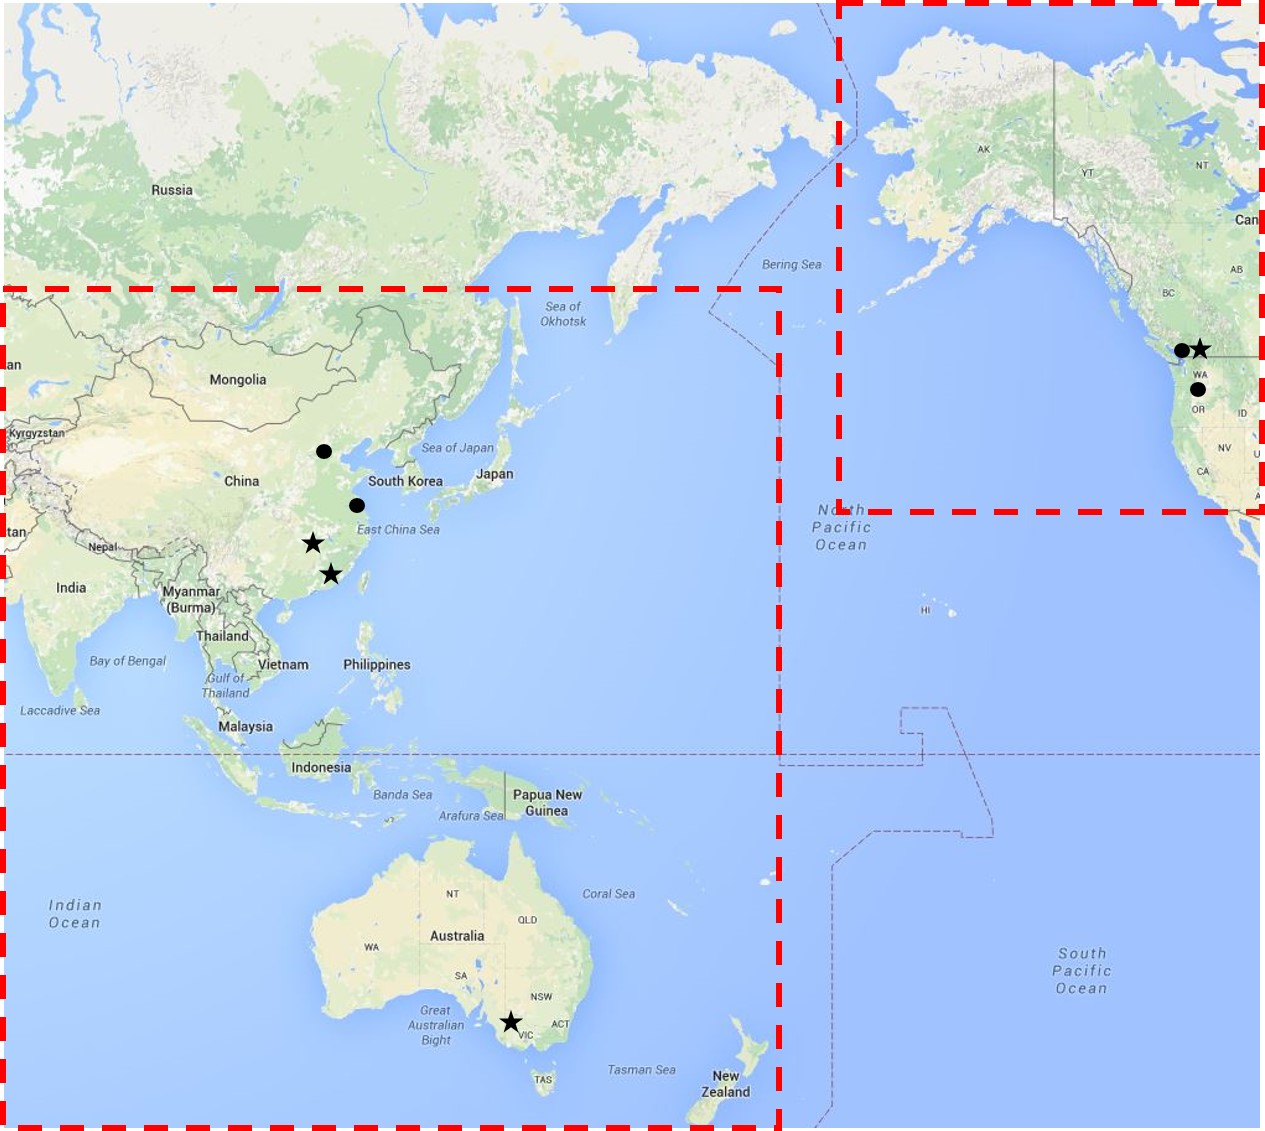 Figure 1: The Phase I study area is highlighted by the red rectangles. Pilot experiment sites (stars) and partners (circles) are also indicated on the map.
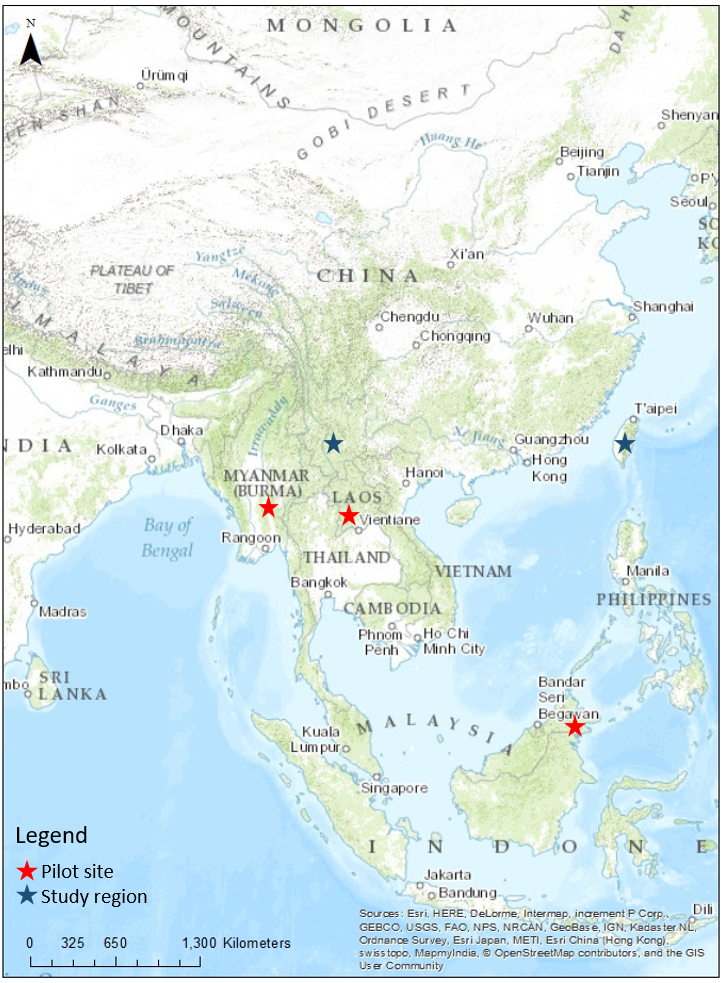
Figure 2: The Phase II study area is focused within Southeast Asia. Pilot sites are indicated with red stars and study regions are indicated with blue stars.
Development of recommendations for SFM
There are numerous tools/models used in sustainable forest management (SFM), strategic planning and scenario testing to assist high-level decision-making. We explored the potential implications of these tools/models in the Asia-Pacific to help managers and policy makers make sound SFM decisions under a changing climate. This was done with the expectation that some of these tools will be adopted by other regions to solve local management issues in a cost-effective manner.
Table 1. A summary of modelling tools employed within the pilot sites.
| Model | Description | Data input | Output | General Application | Spatial Scale |
|
Climate Models |
|||||
| ClimateAP | A climate model for the Asia-Pacific region | Latitude/longitude, elevation (optional) | 208 seasonal and annual climate variables for a specific location (past, present or future) | Generate climate variables for specific locations for historical years and future | Point locations to regional |
|
Niche-based Ecological Models |
|||||
| Climate niche model | A bioclimate envelope model using the Random Forest (RF) algorithm to model the relationship between climate variables and the presence/absence of a species | Seasonal and annual climate variables from ClimateAP, presence data of the species | Projections of the geographical distribution of the climate niche of a species | Species-specific, climate suitability analysis | Fine to regional |
|
Process-based Ecological Models |
|||||
| FORECAST Climate | A management-oriented, forest growth and ecosystem dynamics model that is an extension of the hybrid forest growth model FORECAST created through the dynamic linkage of FORECAST with the stand-level hydrology model ForWaDy. | Reference daily climate data, forest inventory data, historical growth and yield data, nutrient concentrations in different biomass components | Projections of climate impacts on: long-term forest growth and development, ecosystem carbon storage, water stress, drought-related mortality, litter fall and nutrient cycling rates | Forest productivity, growth and yield, forest carbon dynamics, soil fertility, resource trade-off analysis | Stand, with potential to link to landscapes through analysis units |
| TACA-GEM |
Tree and Climate Assessment Model – Germination and Establishment: A mechanistic species distribution model that facilitates an analysis of the response of trees to climate-driven phenological and biophysical variables. It assesses the probability of a species being able to regenerate, grow and survive under a range of climatic and edaphic conditions.
|
Daily climate data, forest inventory data | Species regeneration parameters | Species composition, regeneration | Stand, with potential to link to landscapes through analysis units |
| TACA-GAP | Tree and Climate Assessment Model – Growth and Productivity: A mechanistic model of species regeneration, which is a combination of TACA-EM and BRIND models used to estimate annual net primary productivity and maximum biomass that a species can achieve under given climate and soil parameters. | Daily climate data, forest inventory data | Species productivity parameters | Species composition, productivity | Stand, with potential to link to landscapes through analysis units |
| LANDIS-II | LANDscape Disturbance and Succession: a spatial forest simulation model of ecological processes including succession, seed dispersal, disturbances, and climate change. | Monthly climate data, parameters from TACA models or forest inventory data | A spatial model of species distribution | Species composition, succession | Small to medium landscape |
| CBM-CFS3 | An inventory-based forest ecosystem carbon budget model | Forest inventory data | An evaluation of ecosystem carbon storage | Forest carbon dynamics | Stand to regional |
| DLM-Ecohydro (BEPS-TerrainLab V2.0) | An eco-hydrological model developed from a dynamic land model | Daily climate data, land surface data | Simulates annual mean temperature, evapotranspiration, soil water storage, surface and subsurface runoff, gross and net primary productivity | Forest hydrology and related biogeochemical processes | Small landscape |
| 3-PG | Physiological Principles to Predict Growth: A process-based growth model used to explore the biophysical and bio-physiological interactions influencing stand dynamics of a given species | Monthly climate data | Geographic distribution of species under different climate scenarios and stand volume predictions | Forest productivity | Stand to medium landscape |
|
Model Integration |
|||||
| Landscape Summary Tool (LST) | A tool designed in Microsoft Excel to facilitate the calculation of indicators of ecosystem services, including a variable weighting decision approach. Twenty-seven alternative management scenarios were developed using factorial analysis. | Stand-level attribute database from FORECAST Climate output | An indicator matrix of resource trade-off analysis results | A general framework for scaling up stand-level model output, resource trade-off analysis | Small landscape |
| Patchworks | A strategic decision model using multiple value trade-off analysis and considering 7 climate related indicators | Model output specified for each indicator (see figure 2) | Quantitative comparison of different management strategies | Forest planning, growth and yield, natural disturbance | Small to medium landscape |
A conceptual framework was then developed to integrate models explored in this study to provide high-level SFM decisions. A summary of this framework is given in Figure 2. Further explanation and results from these modelling tools will be shared once findings are published.
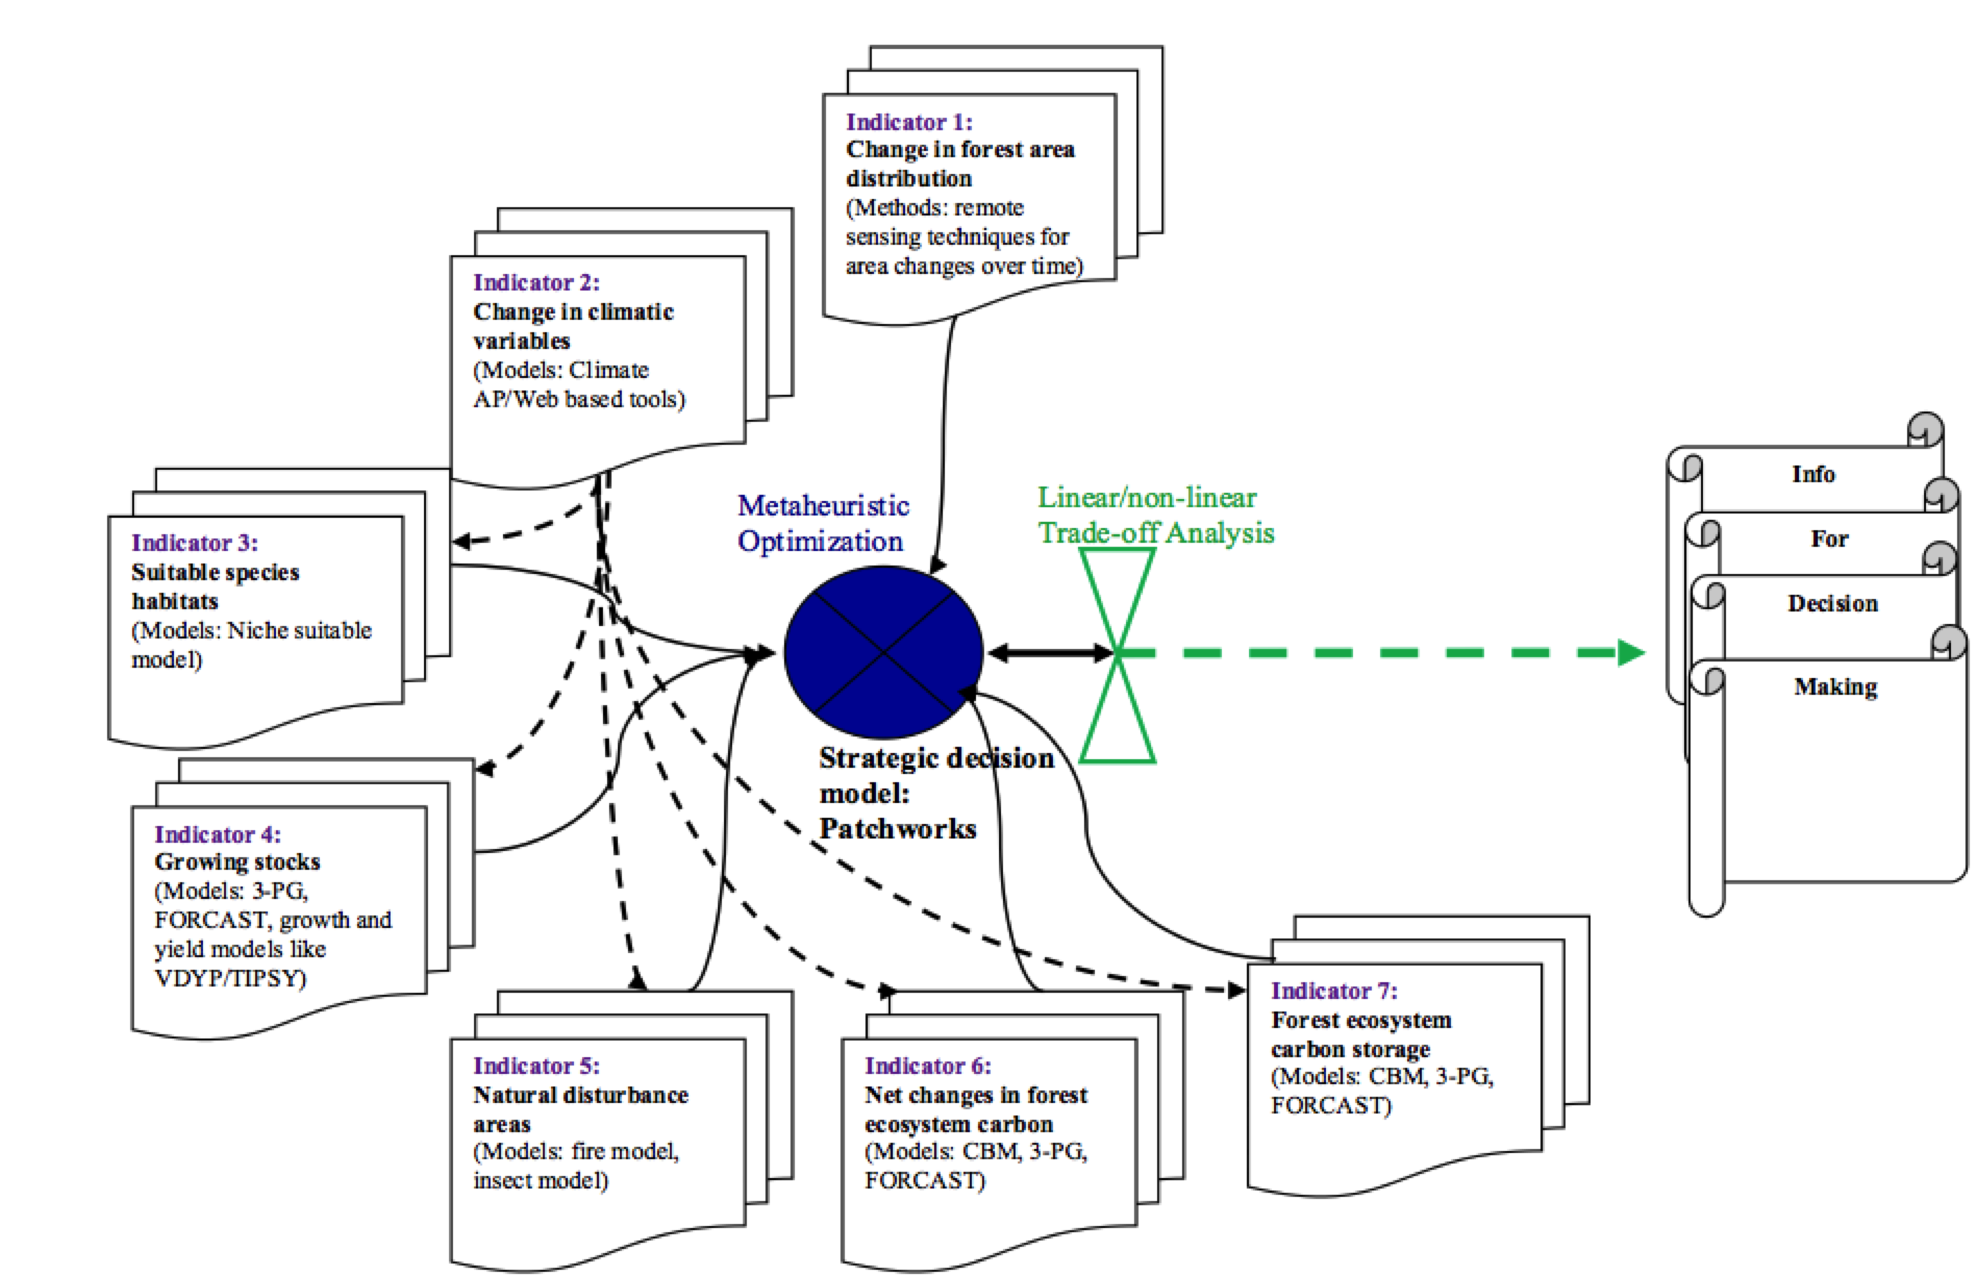
Figure 3. A conceptual flow diagram of the indicator-based decision-support framework.