
Development of a high-resolution climate model, ClimateAP
With a rapidly growing need for climate change related studies and applications, there is increasing demand for high-resolution and high quality spatial climate data. Historical climate data is necessary for building models based on relationships between climate variables and plant performance, while future climate data is essential to predict the impacts of climate change. In both cases, it is desirable to have climate data at high-resolution and high accuracy.
A desktop version of ClimateAP can be downloaded for free for intensive users and a Google Maps based web version is also available for spatial visualization and processing small number of locations. A brochure explaining the model can be found here.
ClimateAP interface and coverage
We developed a software package, ClimateAP, that covers the entire Asia-Pacific region. It requires no installation or mapping programs/abilities. It has a straightforward, user-friendly interface, making it easily accessible to a wide range of people, from researchers to policy makers to forest resource mangers.
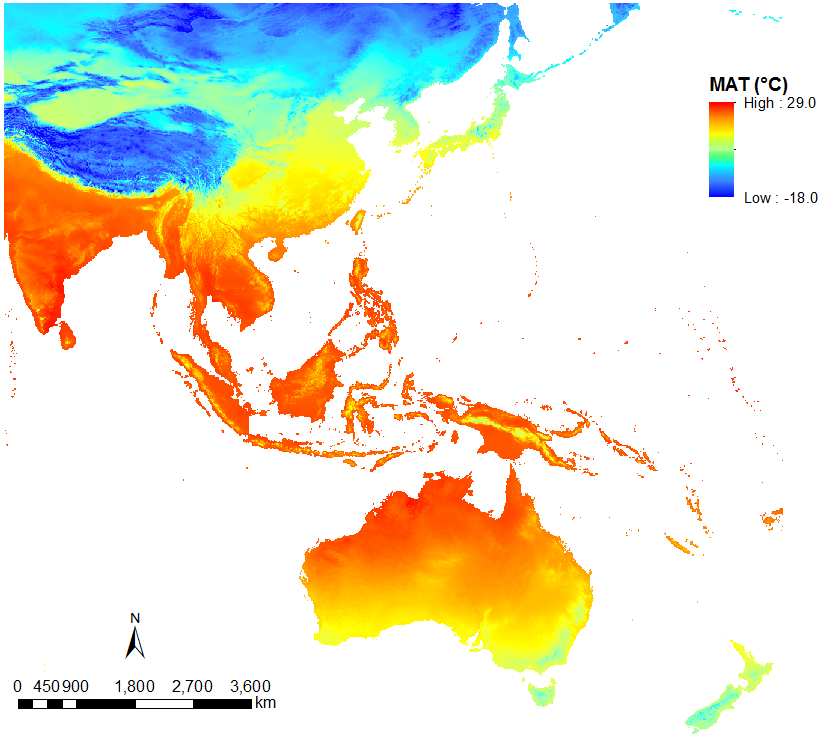 Figure 1. The coverage of ClimateAP
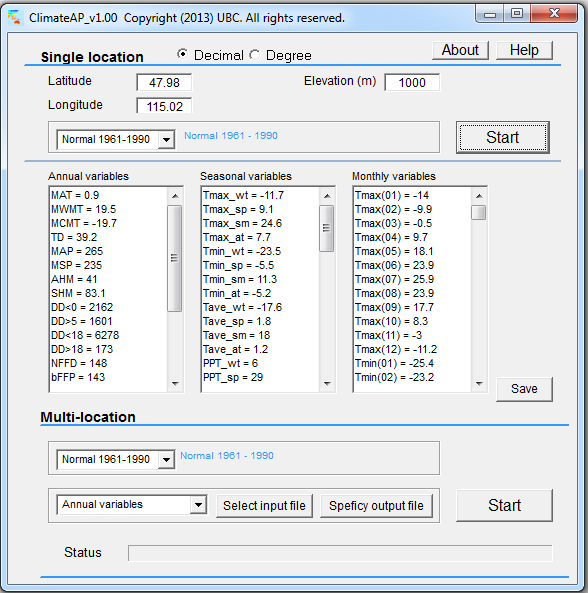
Figure 2. The interface of ClimateAP
ClimateAP database and downscaling
ClimateAP downscales medium-resolution (0.25 x 0.25 arcminute) monthly climate normal data for the reference period 1961-1990 to scale-free point data. Baseline data for this period is from Parameter-elevation Regressions on Independent Slopes Model (PRISM) data for China and Mongolia and from WorldClim data for the rest of the region. Downscaling of baseline data was achieved through a combination of bilinear interpolation and dynamic local elevation adjustments to monthly primary temperature and precipitation variables. A large number of biologically relevant climate variables were calculated and derived from these monthly primary variables. Historical climate data was generated by the Climatic Research Unit at the University of East Anglia and covers the period 1901-2012, while future climate data is based on IPCC General Circulation Models (GCM) from the Fifth Assessment Report (AR5) and includes three normal periods (2011-2040, 2041-2070 and 2071-2100). ClimateAP downscales this historical and future climate data using a delta approach, which replaces the low-resolution historical and future baseline climate data with high accuracy, scale-free baseline climate data generated by ClimateAP.
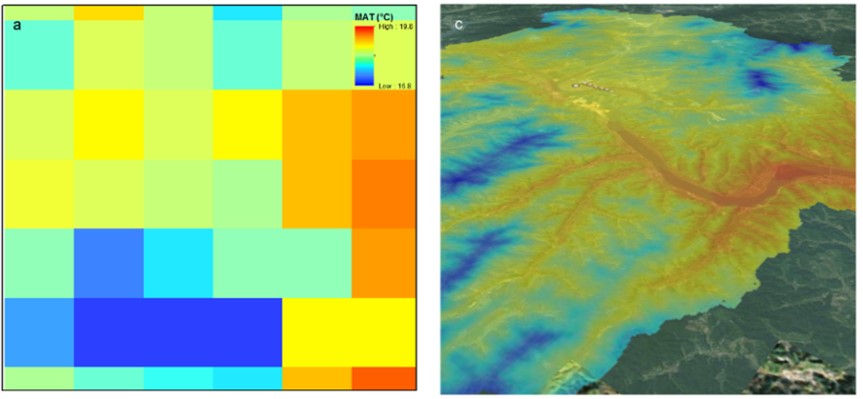
Figure 3. Demonstration of downscaling baseline climate data from 0.25 x 0.25 arcminute (4 x 4 km) resolution to scale-free point data, overlaid on a geographic image.
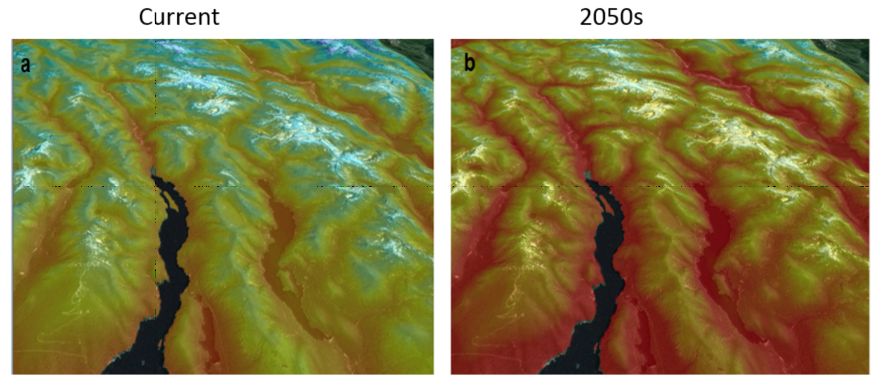
Figure 4. Illustration of the delta method for downscaling GCM data, demonstrating that future climate data generated by ClimateAP can also be at high spatial resolution.
ClimateAP outputs
The output of ClimateAP includes 208 directly calculated and derived climate variables for historical years (1901-2012) and future periods (2020s, 2050s and 2080s). The accuracy of climate variables generated by ClimateAP were evaluated against observations at 1805 weather stations. ClimateAP reduced prediction error substantially for both baseline, historical and future data. It provides climate data for multiple locations and multiple years and can be used for climate based experimental design, modelling climate niches for ecosystems and species, population responses to climate, or to generate climate surfaces to be mapped in ArcGIS.
Significance of ClimateAP
ClimateAP is an invaluable tool for climate change research. It is the best available tool for generating high-resolution climate data at any location in the Asia-Pacific, helping to satisfy the increasing demand for this type of spatial climate data. Its high accuracy will help in building ecological models to generate more useful predictions regarding the impacts of climate change, yet it is simple enough that it can be used by people with varying levels of modelling knowledge. ClimateAP will serve as an essential tool for climate change related studies and applications, providing a means for forest managers to project potential changes in climate for their region. It will facilitate a wide range of climate change research and the development of adaptation and mitigation strategies for crucial forest ecosystems throughout the Asia-Pacific region. This will in turn allow for the development of more successful policy and forest management strategies.
Use of remote sensing data
An additional output of this project is the use of Normalized Difference Vegetation Index (NDVI) datasets in conjunction with climate data to understand how vegetation dynamics respond to climate change. This technology can be used to investigate the correlation between NDVI anomalies and climatic anomalies to determine how the relationship between these factors varies between land-cover types and geographical location. NDVI data can be mapped to easily visualize changes in vegetation growth dynamics and climatic variables over space and time for the region of interest. This can indicate regions and ecosystems of most concern by highlighting regions that are most significantly impacted by climate change and the environmental factors that are contributing most to the change.
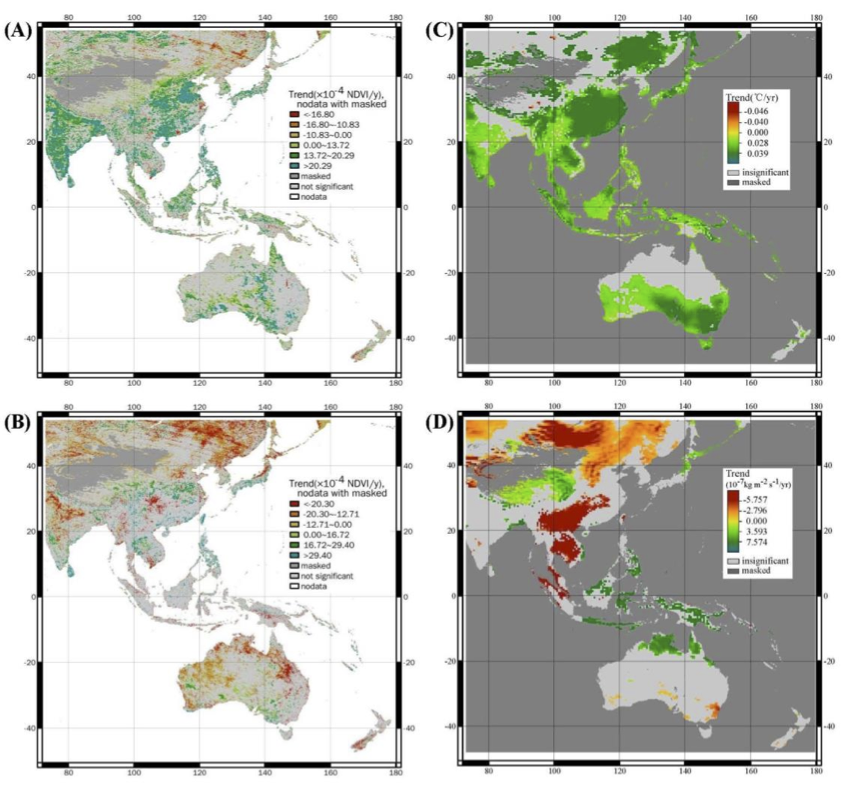
Figure 5. Spatial distribution of changes in vegetation growth dynamics, air temperature and precipitation in the Asia-Australia region from 1982 to 2011. (A) Annual productivity (annual mean NDVI); (B) growth seasonality (annual standard deviation of NDVI); (C) annual mean air temperature; and (D) annual total precipitation.
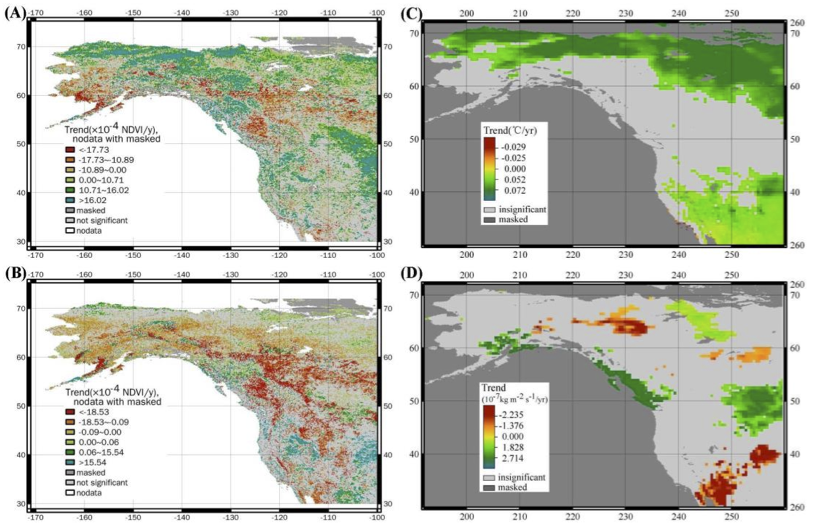
Figure 6. Spatial distribution of changes in vegetation growth dynamics, air temperature and precipitation in the North America region from 1982 to 2011. (A) Annual productivity (annual mean NDVI); (B) growth seasonality (annual standard deviation of NDVI); (C) annual mean air temperature; and (D) annual total precipitation.
The results of this analysis indicate that vegetation productivity and seasonality in the Asia-Pacific region vary among different subregions and ecosystems. Additionally, the spatial patterns observed indicate complexity in vegetation growth dynamics, as well as a nonlinear response of vegetation to global climatic changes and other drivers. This has provided insight into poorly understood yet very important relationships, which can now be further explored using the foundation of knowledge provided by this project.
Work In Progress
For the next phase of the project, ClimateAP will be expanded to not only generate projections for the 3 future periods (2011-2040, 2041-2070, and 2071-2100), but it will soon be able to project future climate change on an annual basis to reflect annual fluctuations and extremes. Specifically, the expanded version of ClimateAP will allow for annual time series projections to be generated for any location in the region in a single run. This advancement will generate more useful data and information that can be used to develop adaptation and mitigation strategies.
Publications
Che, M., Chen, B., Innes, J.L., Wang, G., Dou, X., Zhou, T., Zhang, H., Yan, J., Xu, G., and Zhao, H. (2014). Spatial and temporal variation in the end date of the vegetation growing season throughout the Qinghai-Tibetan Plateau from 1982 to 2011. Agricultural and Forest Meteorology, 189-190, 81-90.
Chen, B., Xu, G., Coops, N.C., Ciais, P., Innes, J.I., Wang, G., and Myneni, R.B. [In Review]. Satellite-observed changes in terrestrial photosynthesis activity trends across the Asia-Pacific region associated with land cover and climate from 1982 to 2011. Journal of Geophysical Research: Biogeosciences.
Chen B., Xu, G., Coops, N.C., Ciais, P., Innes, J.L., Wang, G., Myneni, R.B., Wang, T., Krzyzanowski, J., Li, Q., Cao, L., and Liu, Y. (2014). Changes in vegetation photosynthetic activity trends across the Asia-Pacific region over the last three decades. Remote Sensing of Environment, 144, 28-41.
Wang, T., Wang, G., Innes, J., Chen, B., Li, Q., and Guo, F. (2014). ClimateAP – An easy access to high-resolution climate data for Asia Pacific. [Manuscript].
Xu, G., Zhang, H., Chen, B., Zhang, H., Innes, J.I., Wang, G., Yan, J., Zheng, Y., and Myneni, R.B. (2014). Changes in vegetation growth dynamics and relations with climate over China’s landmass from 1982 to 2011. Remote Sensing, 6, 3263-3283.
Xu, G., Zhang, H., Chen, B., Zhang, H., Yan, J., Chen, J., Che, M., Lin, X., and Dou, X. (2014). A bayesian based method to generate a synergetic land-cover map from existing land-cover products. Remote Sensing, 6, 5589-5613.
Yan, J., Chen, B., Feng, M., Innes, J.L., Wang, G., Fang, S., Xu, G., Zhang, H., Fu, D., Wang, H., Yu, G., and Sun, X. (2013). Research on land surface thermal-hydrological exchange in southern China under future climate and land cover scenarios. Advances in Meteorology, 2013.